
I used to be a trader and scheduler at an energy company that supplied natural gas to residential and commercial customers. I knew nothing about commodity trading before joining the firm, but quickly learned that it was a complex pricing process when combining financial instruments with physical products. We were a small company and handled all our customer care and marketing in house, so when asked what goes into natural gas pricing, our blanket answer would be, “weather, supply, and demand”. Natural gas is mostly used for industrial purposes, to generate electricity, or to heat homes and businesses, which is seasonal and weather dependent.
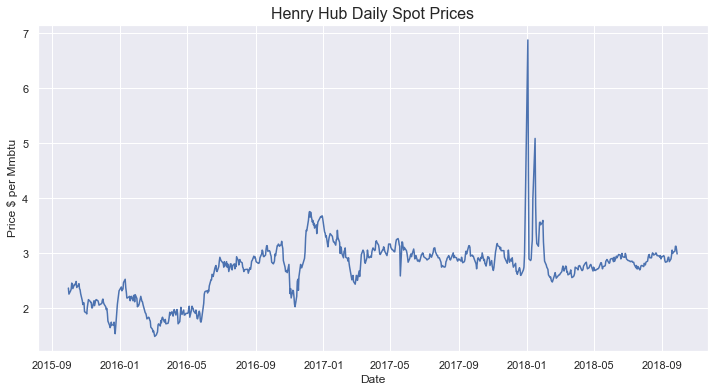
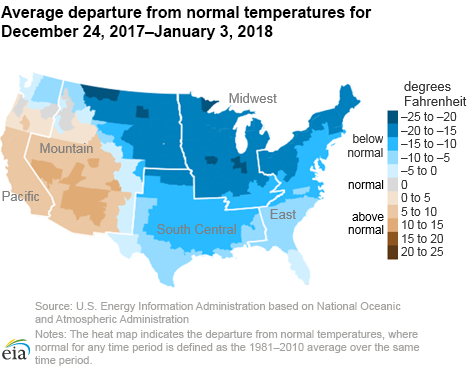
Plotted in the chart below are the daily spot prices of Henry Hub, the main pricing point for the North American natural gas market. The sudden spike you see in January 2018 was, in part, caused by extreme cold weather.
Data
As I developed my data science skills at Metis, I wanted to quantify how much weather really impacted natural gas prices. To do this, I first had to gather some data. I got natural gas spot prices from the past three years (Oct 1, 2015 through Sep 30, 2018) through the Wall Street Journal for 5 natural gas hubs.
I compiled this with daily weather from the nearest physical locations using Dark Sky API. I pulled the daily high and low temperatures (in Fahrenheit), and if there was any, the type of precipitation and the amount of snow.
| Natural Gas Hub | Nearest Physical Location |
| Henry Hub | Erath, Louisiana |
| Transco Zone 3 | Beauregard Parish, Louisiana |
| Transco Zone 6 NY | Linden, New Jersey |
| Panhandle East | Haven, Kansas |
| Opal | Lincoln County, Wyoming |
Methods
During the exploratory data analysis part of the project, I used Seaborn to make pair plots and visualize the data and StatsModels to print out OLS linear regression summaries. My initial R-squares were pretty poor… All hubs had R-squares of near 0 except Transco Z6 NY, which had an R-squared of 0.14 after taking the log of the price. I used the normal R-squared instead of the adjusted R-squared because I ended up using the daily low temperatures as my only feature.
To try to improve this signal further, I used my domain expertise and split out only the winter months, defined by the industry as November 1 to March 31. Many utility tariffs have a clear separation of rules and costs for the summer versus winter seasons. This move bumped up the Transco Z6 NY R-squared to a whopping 0.432. My final feature engineering step was to take the log of the low temperature, which then increased the R-squared to 0.475.
Confirming my results, I performed 10 k-fold cross validation tests for simple linear regression and polynomial regression, and got an R-squared of 0.536 when applying simple linear regression to my hold out test set.

Conclusion & Future Work
Transco Z6 NY winter prices have a higher correlation to low temperatures than the other hubs that I tested. Despite pulling weather data for service areas like Chicago for Panhandle East and Seattle for Opal, the R-squared never exceeded 0.20. Why?
My best guess is that the other hubs’ prices are a reflection for the type of demand. For example, Henry Hub and Transco Z3 are both located in the south, where it doesn’t get too cold and much of the gas is transported elsewhere, either along interstate pipelines or as LNG. In the future, I would like to drill down on why exactly certain hubs’ prices are more sensitive to low temperatures, get more data points and test the relationship between precipitation & snowfall on prices, and potentially expand this project structure to other types of commodities.
For more information and details, check out my github for this project.
Tools used: Python, Pandas, Jupyter Notebook, Matplotlib, Seaborn, scikit-learn, StatsModels
